Traffic Details for March 1st - May 31st 2008
Fri, 06/06/2008 - 20:03 — Ciprian

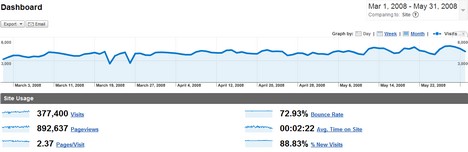
![]() In case you were wondering how are we doing this year, here you have our site's traffic details for the period March 1st - May 31st. As you can see from the screenshots below, we had a total of 377400 visits and 892637 pageviews which means an average of 2.37 Pages/Visit. We were not very satisfied with the number of average pages per visit from our first months of existence so we made a number of tweaks which seem to have payed off. Also, we managed to increase the average time spent on site from 01:43 minutes to 02:22 minutes.
In case you were wondering how are we doing this year, here you have our site's traffic details for the period March 1st - May 31st. As you can see from the screenshots below, we had a total of 377400 visits and 892637 pageviews which means an average of 2.37 Pages/Visit. We were not very satisfied with the number of average pages per visit from our first months of existence so we made a number of tweaks which seem to have payed off. Also, we managed to increase the average time spent on site from 01:43 minutes to 02:22 minutes.
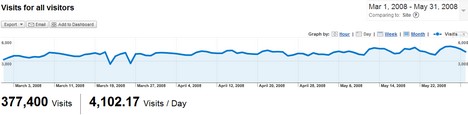
The average number of visits per day is 4102 and it is continuing to climb steadily each month.
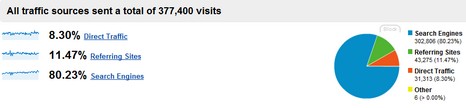
When it comes to traffic sources, the situation is the following: 8.3% is direct traffic, 11.45% is coming from referring sites while 80.23% is coming from search engines.
The 5 most read articles on our site are the following:
- Migrate from Outlook Express to Windows Mail - 32000pageviews
- Windows Vista's biggest problem - 22000 pageviews
- How to uninstall Windows Vista - 22000 pageviews
- How to Map a Network Drive - 21000 pageviews
- How to setup a wireless connection - 20000 pageviews
Related articles:
Traffic Details for our first year of existence

This work is licensed under a Creative Commons Attribution-Noncommercial 3.0 License.
Microsoft, Windows and the Windows logo are either registered trademarks or trademarks of Microsoft Corporation in the United States and/or other countries. Microsoft Corporation in no way endorses or is affiliated with www.vista4beginners.com.
All other products mentioned are registered trademarks and/or trademarks of their respective companies.

Comments
Post new comment